· Rumtoo Quality Team · Quality Control · 10 min read
Recycled Flake Quality Control: 7 Critical Control Points That Determine Your Market Price
A practical guide to the 7 quality control points in a plastic recycling line that directly determine flake purity, moisture, and market value — with specific test methods and action thresholds.
A PET recycler in Turkey was selling hot-washed flake to a European fiber manufacturer at $720/ton — a healthy price for the region. Then, without warning, three consecutive shipments were rejected. The buyer’s lab found PVC contamination at 180 ppm, well above their 50 ppm limit. The recycler had to accept those containers back, reprocess the material (losing yield in the process), and sell the downgraded flake to a less demanding buyer at $480/ton. The total cost of those three rejected shipments — including return freight, reprocessing labor, yield loss, and the price difference — exceeded $60,000.
The root cause? Their single quality check happened at the very end of the line, on the final output silo. By the time they detected the PVC contamination, 45 tons of off-spec flake had already been produced and bagged. If they had been monitoring contamination at the sorting stage and after the sink-float tank, they would have caught the problem within 30 minutes — not three days.
Quality control in plastic recycling is not about testing the end product. It’s about controlling the process at every critical stage so that the end product is predictably good. Here are the seven control points that matter most.
Control Point 1: Incoming Material Grading
Quality starts before the material enters your line. The single biggest source of quality variation in recycled flake is feedstock inconsistency. A bale that looks identical to yesterday’s bale may have twice the contamination.
What to Measure
- Visual contamination estimate: Trained operators can grade bales into tiers (A/B/C) based on visible non-target material. This takes 60 seconds per bale and should be mandatory.
- Spot sampling: For every 10th bale (or every new supplier load), pull a 2–5 kg sample, manually sort it, and weigh the fractions. Record % target polymer, % other polymers, % non-plastic contamination.
- Moisture: Weigh a sample, oven-dry it at 105°C for 2 hours, weigh again. Incoming moisture above 15% indicates prolonged outdoor storage or rain exposure, which often correlates with higher organic contamination.
Action Thresholds
| Grade | Description | Action |
|---|---|---|
| A | <5% total contamination | Process normally |
| B | 5–12% total contamination | Process with enhanced washing parameters (longer hot-wash residence time, higher caustic concentration) |
| C | >12% total contamination | Reject, renegotiate price, or blend with Grade A material at a controlled ratio |
Grading your incoming material is cheap insurance. It also gives you powerful negotiating leverage with bale suppliers — you can prove, with data, why a particular supplier’s material deserves a lower price.
Control Point 2: Post-Shredder Size Distribution
After the material passes through the shredder and crusher, the particle size distribution directly affects every downstream process. Oversized flakes don’t wash effectively because the surface-area-to-mass ratio is too low. Undersized fines pass through screens and are lost, reducing yield.
What to Measure
- Sieve analysis: Once per shift, collect a 500g sample from the crusher output and run it through a standard sieve stack (6mm, 12mm, 18mm, 25mm). Calculate the weight percentage in each fraction.
- Target distribution: For most PET and rigid HDPE lines, aim for 80%+ of material in the 8–16mm range. Film lines should target 15–30mm after the first shredding stage.
Action Thresholds
- If >15% of material is below 6mm → Check crusher screen condition. Worn or torn screens allow undersized particles through.
- If >10% of material is above 20mm → Check blade sharpness. Dull blades tear rather than cut, producing irregular oversized pieces.
A quick visual inspection often suffices between formal sieve tests. If the crusher output looks noticeably different from normal — more dust, larger chunks, irregular shapes — investigate immediately rather than waiting for the next scheduled test.
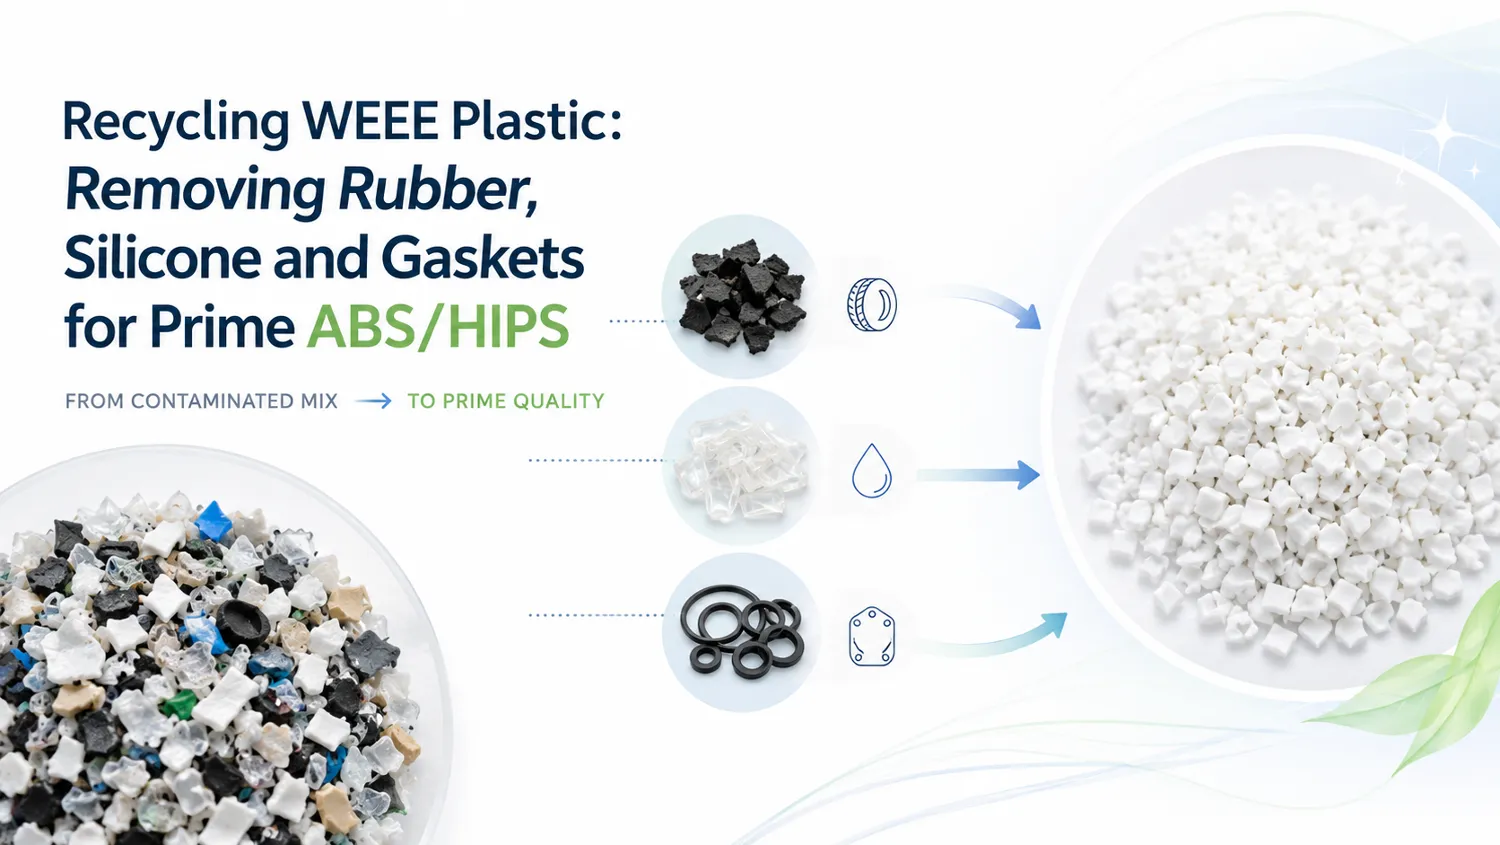
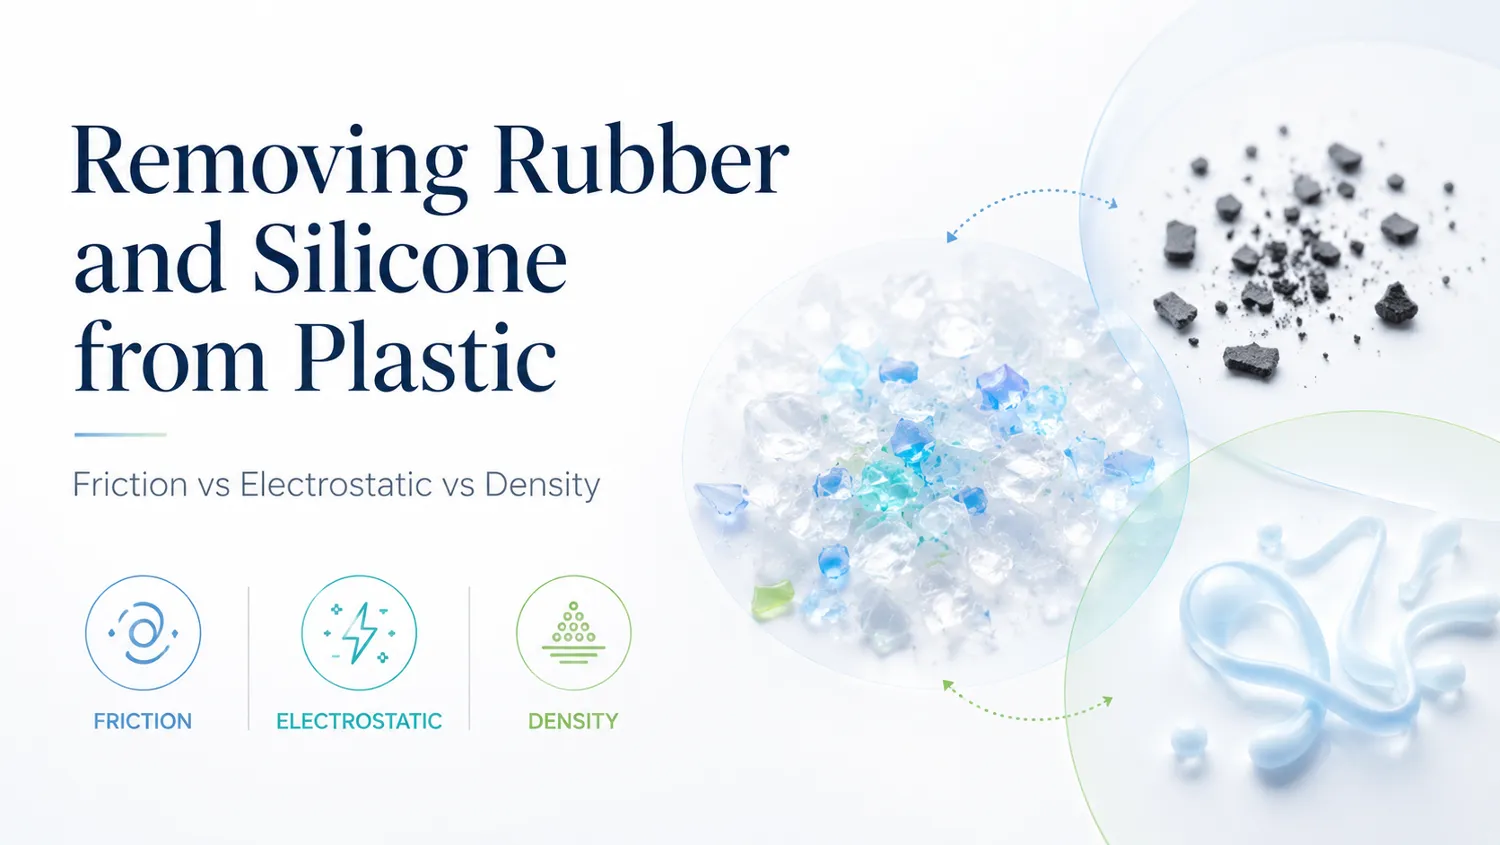
Control Point 3: Post-Wash Contamination
This is the most important quality gate on the line. The washing system is where contamination is either removed or locked in. If contaminants survive the wash stage, no downstream process can fix them.
What to Measure
- Surface cleanliness (visual): Clean flakes should be uniformly colored with no visible dirt residue, adhesive spots, or discoloration. Develop a visual reference standard — a sealed bag of “acceptable” flake that operators compare against.
- Paper/label content: For PET lines, residual label content is a critical defect. Inspect a 200g sample and manually pick out any visible label fragments. Target: <0.5% by weight.
- pH of surface residue: After hot caustic washing, flake surface pH should be 7.0–8.5 after rinsing. pH >9.0 indicates insufficient rinsing, which will cause yellowing during extrusion.
Action Thresholds
- Visible contamination on >5% of flakes → Check friction washer condition (paddle wear, screen tears), verify hot-wash temperature and caustic concentration, check water loop quality.
- Label content >0.5% → Increase hot-wash temperature or residence time. If labels are PVC shrink sleeves, verify that the label removal stage before washing is functioning correctly.
Control Point 4: Sink-Float Separation Efficiency
The sink-float tank separates materials by density, and it’s where most cross-contamination between polymer types occurs. For PET lines, this stage separates PET (sinks) from PE/PP caps and labels (float). For PP/PE film lines, the sink-float removes heavier contaminants (stones, glass, PET fragments).
What to Measure
- Purity of the target fraction: Once per shift, sample 500g from the sink fraction (for PET) or float fraction (for PE/PP) and manually sort to determine % target polymer vs. contamination.
- Loss rate: Weigh and test the reject fraction. Excessive target polymer in the reject stream means you’re losing yield unnecessarily — typically due to incorrect water level, insufficient agitation, or material that hasn’t been fully liberated (labels still attached to flakes).
Action Thresholds
- Target polymer purity <97% → Check tank water level (should be stable and at design height), verify paddle speed, inspect the overflow weir for leveling issues.
- Target polymer in reject stream >5% → Material may not be adequately liberated. Check upstream washing effectiveness.
Control Point 5: Post-Drying Moisture Content
Moisture is the silent killer of pellet quality. Even small variations in flake moisture cause disproportionate problems during extrusion: foaming, voids, inconsistent melt viscosity, and surface defects on the final pellet.
What to Measure
- Gravimetric moisture test: Weigh a 100g sample from the centrifugal dryer output, oven-dry at 105°C for 1 hour, reweigh. Calculate: moisture % = (wet weight – dry weight) / wet weight × 100.
- Rapid inline check: Many operations use a handheld infrared moisture meter for quick spot-checks between formal oven tests. These are less precise (±0.3%) but provide immediate feedback.
Action Thresholds
| Material | Maximum Moisture | Action if Exceeded |
|---|---|---|
| PET flake (fiber grade) | 1.0% | Check dryer screen for blockage, verify spin speed, inspect drive belt tension |
| PET flake (food grade) | 0.5% | Add or verify thermal dryer stage |
| HDPE/PP rigid flake | 1.0% | Check dryer, consider adding a thermal stage |
| PE/PP film | 3–5% (pre-densifier) | Check squeeze dryer and centrifugal dryer performance |
If moisture consistently exceeds target despite normal dryer operation, the problem is likely upstream — the material is carrying more water out of the wash tanks than the dryer was designed to handle. Check wash tank water levels and drain conveyor angles.
Control Point 6: Final Product Lab Testing
Before any material is bagged, big-bagged, or loaded into a silo for shipment, a comprehensive lab test confirms that the batch meets customer specifications.
Standard Test Panel for PET Flake
| Parameter | Test Method | Fiber-Grade Spec | Food-Grade Spec |
|---|---|---|---|
| PVC content | Dissolution in THF + titration, or XRF | <50 ppm | <20 ppm |
| Polyolefin content | Sink-float in calibrated liquid | <50 ppm | <20 ppm |
| Moisture | Oven-dry gravimetric | ≤1.0% | ≤0.5% |
| Intrinsic viscosity (IV) | Viscometer (dilute solution) | ≥0.60 dl/g | ≥0.72 dl/g |
| Color (b* value) | Spectrophotometer | <3.0 | <2.0 |
| Bulk density | Measured volume/weight | 350–500 kg/m³ | 350–500 kg/m³ |
| Metal contamination | Metal detector or ICP-OES | <20 ppm | <10 ppm |
Testing Cadence
- Per shift: Moisture, visual purity check, bulk density
- Per batch/lot: Full lab panel before release
- Weekly: Trend analysis of all parameters, reviewed in the KPI dashboard meeting
Control Point 7: Pre-Shipment Release and Traceability
The final control point is administrative but critical: a documented release process that prevents off-spec material from reaching the customer.
Release Protocol
- Every lot receives a unique lot number tied to production date, feedstock source, and lab test results.
- Lab results are compared against the customer specification sheet. Any parameter outside spec triggers a hold.
- A designated Quality Manager (not the production operator) signs off on the release. This separation of duties prevents the conflict of interest where production pressure overrides quality judgment.
- Retain a 2 kg sample from every released lot for 90 days. If a customer claim arises, you have physical evidence to test.
Traceability
Full traceability from incoming bale to shipped lot is increasingly demanded by European and North American buyers, especially for food-grade applications. At minimum, record:
- Incoming bale supplier, date received, grade
- Production date and shift
- All lab test results
- Shipping destination and customer order number
This traceability data is your defense against unfounded customer claims and your evidence for continuous improvement.
Building a Quality Culture, Not Just a Quality System
Checklists and lab tests are necessary but insufficient. The plants that consistently produce premium-grade flake share one cultural trait: everyone on the line understands how their stage affects the final product quality and price.
The friction washer operator who understands that a torn screen means contaminated flake reaching the customer’s extruder will report the problem immediately. The forklift driver who understands that mixing Grade A and Grade C bales on the infeed belt creates an uncontrollable quality swing will keep them separate.
Invest 30 minutes per month in a line-walk quality review where operators, QC staff, and management walk the entire process together, discuss recent quality data, and identify improvement opportunities. This single habit does more for flake quality than any piece of test equipment.
Frequently Asked Questions
How much does a basic QC lab setup cost?
A functional lab for PET flake testing (oven, precision balance, sieve stack, pH meter, color meter, basic IV measurement) can be set up for $8,000–$15,000. PVC detection via XRF adds another $15,000–$25,000 for a handheld unit. This investment pays for itself with the first avoided shipment rejection.
Should we test every big bag before shipping?
For new customer relationships and food-grade applications, yes — test every lot. For established relationships with consistent feedstock, you can move to statistical sampling (e.g., test every 3rd lot) once you have at least 20 consecutive lots of passing results. But always retain samples from every lot.
What’s the most common cause of sudden quality drops?
Feedstock change is the #1 cause. A new supplier, a seasonal shift in collection quality, or a bale that was stored outdoors in rain can all introduce contamination that your standard process settings weren’t designed for. This is why Control Point 1 (incoming material grading) is so important — it catches the problem before it enters the line.
How do we justify QC investment to management?
Frame it as risk reduction and price protection. The difference between “standard” and “premium” flake pricing is typically $80–$150/ton. For a plant producing 500 tons/month, consistent premium-grade quality is worth $40,000–$75,000/month in additional revenue compared to selling standard-grade. A single rejected shipment costs far more than a year of QC operations.
Can we automate quality testing?
Inline measurement for moisture (NIR probes) and metal contamination (tunnel metal detectors) is mature and cost-effective. Color measurement can also be automated with inline spectrophotometers. PVC detection inline is more expensive but available. Full automation of the QC process is a medium-term investment that most plants pursue after stabilizing manual QC operations first.
Next Steps
Ready to implement or upgrade your quality control program? Talk with Rumtoo engineers about integrating QC checkpoints into your line design, or review our PET project planning guide for a complete overview of building quality into a new project from day one.
References
- flake quality
- contamination control
- recycling process